Slow requests and database access
Trace slow endpoints, repeated queries and N+1 loading. Review SQL, execution plans, indexes and caching when the database is involved; separate database time from Ruby work and external calls.

Services for existing applications
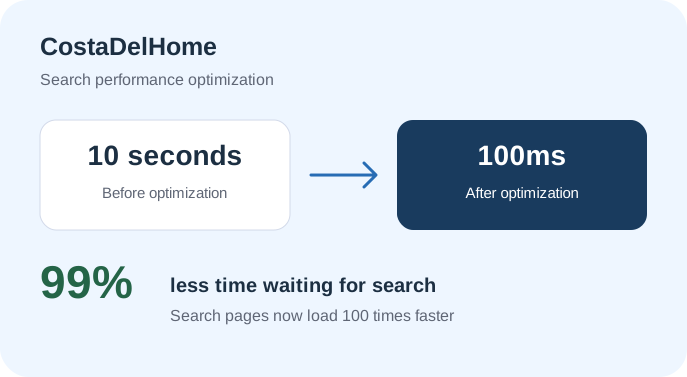
CostaDelHome’s search pages went from 10 seconds to 100ms after our performance work. If slow requests or background processing are holding your product back, we investigate the cause and validate changes against an agreed baseline.
Trace slow endpoints, repeated queries and N+1 loading. Review SQL, execution plans, indexes and caching when the database is involved; separate database time from Ruby work and external calls.
Inspect queue age, throughput, retries and worker contention. Trace long-running jobs and third-party calls that can block processing or exhaust request time limits.
Profile object allocation, memory growth and expensive Ruby processing. Review payload size and rendering work before deciding whether more infrastructure is justified.
Agree the slow workflows, representative dataset and load conditions. Record request timings, query counts, queue delay or memory use as appropriate, together with the measurement method.
Receive traced bottlenecks with supporting evidence, proposed changes, expected impact, effort and risk. Distinguish quick fixes from changes that need a separate implementation scope.
Agree whether the engagement covers diagnosis only or delivery too. For implemented changes, compare the same workload before and after, check correctness and document monitoring and rollback steps.
Success criteria belong to your application. The CostaDelHome result is a documented client outcome, not a guaranteed result for every project.
Use the same workflow, dataset and environment for before-and-after comparisons. Record cache state and concurrency so a faster result can be explained.
Track median and tail request latency where traffic allows, error and timeout rates, queue wait time and worker throughput. Confirm that faster processing preserves the expected behavior.
Documented client work
Documented search page loading fell from 10 seconds to 100ms, a 99% reduction. The case study reports an application-level result; it does not identify a PostgreSQL-specific intervention.
Read the case study →Redesigned DelayedJob handling and dispatching to unblock a stalled queue and eliminate recurring daily Heroku H12 errors.
Read the case study →Explore the next step
Explore focused services for your application and the technical experience behind our work.
Related service
Investigate slow SQL, execution plans, indexes, locks and connection pressure with a focused database engagement.
Explore the service →Engineering article
Explore how SQL knowledge helps identify bottlenecks and improve Rails application performance.
Read the engineering article →Engineering article
Read a practical comparison of Ruby and SQL approaches, with measurements of optimization results.
Read the engineering article →Related service
Diagnose recurring failures, stabilize production and document a recovery plan.
Explore the service →Related service
Keep production support, dependency updates and continued feature development in one prioritized backlog.
Explore the service →Tell us about your application, the current problem and your priorities. We will agree on the scope, access needed and a practical first step.
